Introduction

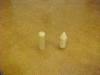
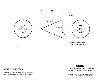
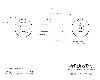
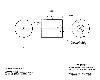
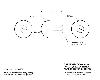
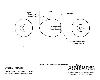
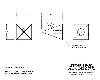
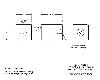
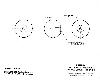
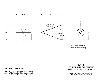
Geometric shapes all have different drag effects in a flowing air stream. The drag on an object due to air velocity varies with the surface area, roundness and surface finish. In this experiment, drag values and effects of drag on various objects were observed and recorded. The objects that were tested consisted of : cone, triangle, rectangle, cube, egg, cylinder, convex cylinder, pyramid, stepped cone and sphere.

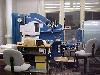
Experimental Procedure
  1. Ten shapes (shown in figure links below) were built from hardwood to the specified dimensions. The shapes were then sanded with 100 grit, 150 grit and 220 grit sand paper to attain the desired finish. A 1/4" was drilled in the center of the specimens to insert the Tinnerman Tee Nut (1/4" - 20UNC x 9/16" long) for attaching the specimen to the sting mount. The dimensions were checked and recorded for easy access during the experiment.
  2. After the experiment was set up, the object was placed on the sting mount in the wind tunnel. The wind tunnel was secured and turned on. Drag was recorded at roughly 15 different velocities ranging from 10 meters/seconds to 56 meters/ seconds. This process was repeated for the remaining 9 objects.
Download Files
FileTitleTypeSize
CONE.pdfPrintable Diagram of Cone Adobe Acrobat 58K
CONE_STEPPED.pdfPrintable Diagram of Cone - Stepped Adobe Acrobat 59K
CUBE.pdfPrintable Diagram of Cube Adobe Acrobat 57K
CYLINDER.pdfPrintable Diagram of Cylinder Adobe Acrobat 60K
CONVEX_CYLINDER.pdfPrintable Diagram of Cylinder - Convex End Adobe Acrobat 62K
EGG.pdfPrintable Diagram of Egg Adobe Acrobat 64K
PYRAMID_4_SIDED.pdfPrintable Diagram of Pyramid - 4 Sided Adobe Acrobat 61K
RECTANGLE.pdfPrintable Diagram of Rectangle Adobe Acrobat 61K
SPHERE.pdfPrintable Diagram of Sphere Adobe Acrobat 58K
TRIANGLE.pdfPrintable Diagram of Triangle Adobe Acrobat 60K
Experimental Data
Download Files
FileTitleTypeSize
CONE.xlsResults for Cone Microsoft Excel 14K
CONE_STEPPED.xlsResults for Cone - Stepped Microsoft Excel 14K
CUBE.xlsResults for Cube Microsoft Excel 13K
CYLINDER.xlsResults for Cylinder Microsoft Excel 13K
CONVEX_CYLINDER.xlsResults for Cylinder - Convex End Microsoft Excel 14K
EGG.xlsResults for Egg Microsoft Excel 13K
PYRAMID_4_SIDED.xlsResults for Pyramid - 4 Sided Microsoft Excel 14K
RECTANGLE.xlsResults for Rectangle Microsoft Excel 14K
SPHERE.xlsResults for Sphere Microsoft Excel 14K
TRIANGLE.xlsResults for Triangle Microsoft Excel 13K
Results.xlsResults for all objects Microsoft Excel 31K
Analysis
  1. From the drawing determine the frontal area for each object.
  2. From the available table, calculate the Reynolds Number and Drag Coefficient for each object.
  3. Plot Drag versus Velocity for each geometry.
  4. Plot CD versus Re for each geometry.
  5. Compare with expected values and discuss.