Introduction

From the very beginning, race car designers have realized the important relationship between aerodynamic drag and vehicle performance. A reduction in drag will results in the attainment of a higher speed for the same amount of engine power. A reduction in aerodynamic drag will also make available a greater power surplus at any speed below the top speed of the vehicle. The greater the power surplus, the greater the rate of acceleration and the lower the lap time will be.

Each year, the Penn State Formula Racing Team produces a mini Formula style racing car. Competition has gotten so fierce that small modifications can mean the difference between winning and 
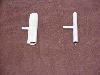
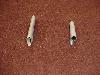
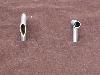
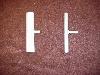
losing. In the past, the team has used aerodynamic tubing for the A - arms on the car. This is a commong practice in Formula style racing, however Formula style race cars can attain speeds over 200 mph. The Penn State Formula style race car has a top speed of approximately 80 mph, and is run at an average of 35 mph through a road course.

It is the desire of the Penn State Formula Racing Team to determine if any benefit, and if so how much, is gained from using the aerodynamic tubing compared to standard round tubing at lower speeds, as seen by the mini Formula car.

Download Files
FileTitleTypeSize
WindTunnelMovieA.mpgWind Tunnel Movie MPEG Movie 343K
Experimental Procedure

1. SPECIMEN PREPARATION

A 5" long, 0.5" diameter test specimen of each of the two types of tubing was prepared, so that it could be threaded onto the mounting posts in the wind tunnel and the water channel). The test specimens were prepared in the Learning Factory. The specimens were created by welding an appropriate size nut in the center of each of the tubes.

2. WIND TUNNEL EXPERIMENT

  • Calibrate the pressure transducer and drag balance.
  • Mount the aerodynamic tube spanwise in the wind tunnel.
  • Secure the wind tunnel and turn on.
  • Measure velocity and drag at 14 different velocities ranging from 9 m/s to 56 m/s.
  • Repeat the same procedure for the round tube.

3. FLOW VISUALIZATION EXPERIMENT

  • Prepare the water channel and dye visualization.
  • Mount the two types of tubing in the undergraduate closed-loop water tunnel, and record flow visualization images at various water velocities similar to those experienced by the mini Formula car, these images will be used as visual aids to assist in the explanation of the results.
  • Record flow visualization images for the two test specimens at various water velocities, using the supplied SLR camera.
Experimental Data
Download Files
FileTitleTypeSize
Results.xlsResults for the two geometries Microsoft Excel 14K
Analysis
  1. On one figure, plot Drag versus Velocity for both geometries (dimensional). Label axes and curves.
  2. From the available table, calculate the Reynolds Number and Drag Coefficient for each geometry.
  3. On one figure, plot CD versus Re for both geometries (nondimensional). Label axes and curves.
  4. Compare with expected values and discuss.
  5. The current Formula car has 49 inches of tubing in the A - arms. Use this information to determine the total difference in power loss between the two different types of tubing.
  6. Organize the data collected and conclusions, and present them in a manner useful to the Penn State Formula racing team.