![]() Definition :
Definition :
The mean X, is the sum of the scores divided by the number of scores.
![]() Formula :
Formula :
The following formula both defines and describes the procedure for finding the mean:
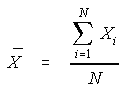
where Σ Xi is the sum of the scores and N is the number of scores.
![]() Illustration :
Illustration :
Application of the above formula to the following data
32
35
36
37
38
38
39
39
39
40
40
42
45
yields the following results:
![]() Application :
Application :
Use of means as a way of describing a set of scores is fairly common; batting average, bowling average, grade point average, and average points scored per game are all means. Note the use of the word "average" in all of the above terms. In most cases when the term "average" is used, it refers to the mean, although not necessarily. When a politician uses the term "average income", for example, he or she may be referring to the mean, median, or mode.
![]() Applet :
Applet :
![]() Examples for practice
:
Examples for practice
:
Lucy bought seven pens. Four of the pens cost a dollar each. Three of the pens cost 30 cents each. What was the average cost ( mean ) of each pen? (Solution)
Juan has played in four baseball games this season. He struck out an average of twice per game. In the last three games, he didn�t strike out at all. How many times did he strike out in the first game of the season? (Solution)
![]() Excel Functions
:
Excel Functions
:
Statistical functions can be accessed by clicking on Insert and then choosing Function from the drop down menu.
Some commonly used functions are
Mean:
Syntax: Average (number1, number 2, ...)
Description: Returns the average( arithmetic mean ) of its arguments, which can be numbers or names, arrays or references that contain numbers.
Median:
Syntax: Median (number1, number 2, ...)
Description: When the data values are arranged in ascending or descending order, the middle value is the median. However to use the median function, it is not necessary to presort the data, the function does it implicitly.
Mode:
Syntax: Mode (number1, number 2, ...)
Description: Returns the most frequently occurring or repetitive value in an array, or range of data.
Sort:
Syntax: Sort (number1, number 2, ...)
Description: This command appears under the Data tab in the menu. You can sort a given range of values in ascending or descending order.
![]() Find the mean for the
following data using Excel :
Find the mean for the
following data using Excel :
![]() Further comments :
Further comments :
The mean is sensitive to extreme scores. For example, the mean of the following data is 39.0, somewhat larger than the preceding example.
|
32 |
35 |
36 |
37 |
38 |
38 |
39 |
39 |
39 |
40 |
40 |
42 |
55 |
In most cases the mean is the preferred measure of central tendency, both as a description of the data and as an estimate of the parameter. In order for the mean to be meaningful, however, the acceptance of the interval property of measurement is necessary. When this property is obviously violated, it is inappropriate and misleading to compute a mean. Such is the case, for example, when the data are clearly nominal categorical. An example would be political party preference where 1 = Republican, 2 = Democrat, and 3 = Independent. The special case of dichotomous nominal categorical variables allows meaningful interpretation of means. For example, if only two levels of political party preference was allowed, 1 = Republican and 2 = Democrat, then the mean of this variable could be interpreted. In such cases it is preferred to code one level of the variable with a 0 and the other level with a 1 such that the mean is the proportion of the second level in the sample. For example, if gender was coded with 0 = Males and 1 = Females, then the mean of this variable would be the proportion of females in the sample
For a comparison between mean and median -
http://standards.nctm.org/document/eexamples/chap6/6.6/