 | ||||
 | ||||
|
|
| Introduction | |
The Nusselt number is an important dimensionless parameter that represents the temperature gradient at a surface where heat transfer by convection is taking place. It is a very important number for convection problems. It is a function of the Reynolds number, the Prandalt number, and if the fluid is still at the thermal entry region, the Nusselt number will also vary as a function of the length of the tube. After the thermal boundary layer becomes fully developed, the Nusselt number becomes constant. When the flow is turbulent, the momentum and thermal boundary layers develop very fast because of the mixing; therefore if the ratio of length/diameter > 60 the flow can be considered fully developed throughout the length of the pipe. The critical Reynolds number is ~2,300 and fully turbulent conditions occur at Reynolds number greater than10,000. Between a Re of 2,300 and 10,00 the flow is considered to be in transition. | |
| Experimental Procedure | |
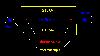
An experiment was done with an apparatus consisting of a 10' long heated steel pipe with an inside diameter of .62 inches. The fluid passed through a calming section before entering the heated section of the pipe to eliminate hydrodynamic entrance effects. The pipe was heated with condensating steam which crated a constant temperature pipe surface. A constant speed, positive displacement pump was used to pump the fluid through the pipe. All measurements where made when the system was at equilibrium. Below there is an illustration of a positive displacement pump. The liquid was passed through a mixer before its initial and final temperature were measured. This was done in order to obtain the fluid's bulk temperature. The experiment was repeated at different flow rates with several fluids. In the illustration below, the yellow thermocouples measure the fluid's temperature (t), and the red thermocouples are attached to the wall to measure the wall temperature (T). (in the experimental data, 1 represents the inlet and 2 the outlet) | |
| Experimental Data | |
| Analysis | |
Convert the given data from US units to SI units using the convert ( nuber, "from", "to") function in Excel, then, for each case, calculate the following:
| |