Introduction

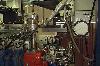
The Diesel engine was invented by Rudolph Diesel in the 1890's. It is very similar to the conventional gasoline engine, with the difference that the fuel is ignited by its contact with the compressed hot air. In a conventional gasoline engine, the air fuel mixture is compressed as the piston moves up, then the fuel is ignited by the spark plug. If the compression ratio of a spark ignited (SI) engine is too high, the fuel auto ignites before it is supposed, this is called engine knock and is not desired. In a diesel engine, only air is compressed as the piston moves up, at the instant when combustion is desired fuel is injected into the chamber and is instantly ignited by the hot compressed air (see movie).

The thermal efficiency of an IC engine depends mostly on the compression ratio. As explained above, the compression ratio of a spark ignited engine is bounded by the auto ignition of the fuel. In a Diesel engine, the only limit to the compression ratio is the mechanical strength of the engine, for this reason Diesel engines run at higher compression ratios and higher efficiencies than the conventional gasoline engines.

Experimental Procedure

A direct injection, single cylinder diesel engine was used for the experiment. The engine setup provides full optical access to the combustion chamber (from which the movie was filmed) and is used for the analysis of combustion gases. The engine is also equipped with a pressure transducer inside the chamber and an encoder on the crankshaft to determine its position.

The engine was started, the pressure in the combustion chamber and the position of the crankshaft where recorded for 6 cycles. The characteristics of the engine are:

bore82.55 mm
stroke114.3 mm
arm500 mm
compression ratio14:1

Download the following file to see how the volume of the cylinder relates to the crank angle.

Download Files
FileTitleTypeSize
volume-crank.docVolume of cylinder vs. crank angle Microsoft Word 23K
Experimental Data
Download Files
FileTitleTypeSize
diesel_data.xlsDiesel Engine Experimental Data Microsoft Excel 506K
Analysis
  1. Derive an expression of volume as a function of crank angle and convert the given crank angle data into volume.
  2. Plot the P-V diagram for the first data series.
  3. Determine the MEP (mean effective pressure) for each series of the data.
  4. Average the data and determine the average MEP.
  5. Calculate the standard deviation of the MEP about the average value.